Monitoring & Alerting
The relayer exposes metrics on the port number specified by the argument --metrics. Port 9090 is the default, though any valid port can be chosen.
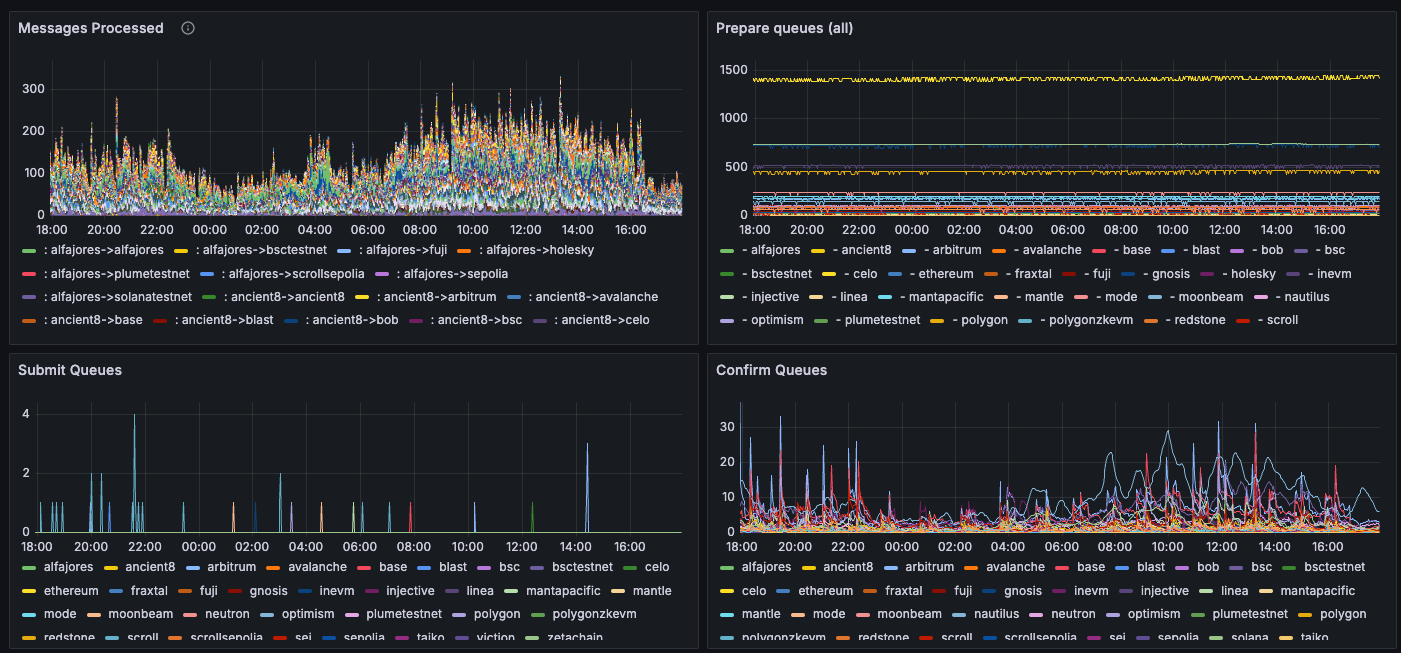
We recommend using Prometheus to scrape these metrics and Grafana to visualize them, using this dashboard JSON template, as seen below. The benefit of this dashboard is that it displays multiple validators at the same time. The screenshot shows metrics grouped by chain or by kubernetes pod.
If running as a Docker image, make sure to port-forward the metrics endpoint port. For, instance, to forward port 9090 on the local port 80, add the following flag to your docker run command: -p 9090:80
Metrics
The dashboard template includes the following metrics.
| Metric | Description |
|---|---|
hyperlane_messages_processed_count | The messages processed by the relayer, by origin and destination chain ("Messages Processed"). |
hyperlane_submitter_queue_length{queue_name="prepare_queue"} | Length of the submitter's prepare queue ("Prepare Queues"). Each destination chain has a submitter running, and all pending / retriable messages end up in the prepare queue, awaiting to be (re)submitted. An increase in this queue may either mean that the volume of messages exceeds the relayer's processing throughput or that submitting is failing for various reasons (bad RPCs, low balance). |
hyperlane_submitter_queue_length{queue_name="submit_queue"} | Length of the submitter's submit queue ("Submit Queues"). These are messages that have been prepared but not submitted yet. |
hyperlane_submitter_queue_length{queue_name="confirm_queue"} | Length of the submitter's confirm queue ("Confirm Queues"). These are messages that have been submitted but not confirmed (finalized) yet. |
Other relevant metrics include:
| Metric | Description |
|---|---|
hyperlane_wallet_balance{agent="relayer"} | The relayer's balance on every chain, expressed in the lowest denomination unit |
hyperlane_block_height | The block height of the RPC node the agent is connected to. If this metric is not increasing, the RPC may be unhealthy and need changing. |
hyperlane_span_events_total{agent="relayer", event_level="error"} | The total number of errors logged. If the derivative of this metric exceeds 1 over the last hour, at least a low-severity alert is warranted. Note that the dashboard query groups metrics by kubernetes pod name, so you may need to adjust this query if you are not running in a kubernetes environment. |
hyperlane_span_events_total{agent="relayer", event_level="warn"} | The total number of warnings logged. If the derivative of this metric exceeds 1 over the last hour, at least a low-severity alert is warranted. Note that the dashboard query groups metrics by kubernetes pod name, so you may need to adjust this query if you are not running in a kubernetes environment. |
Alerts
The metrics above can be combined to create alerts that minimize false positives. Some example critical alerts:
- the prepare queue length has been increasing, and the confirm queue length was zero, and error/warning count diffs have been increasing, over the last 30 minutes. This could mean that the relayer has run out of balance and cannot pay for gas, or that the destination chain RPC url is not working correctly, or just that all new messages are unprocessable
hyperlane_wallet_balancehas dropped below a certain threshold. For example, the current balance divided by the difference in the last 24h is less than 2, meaning balance must be topped up within two dayshyperlane_block_heighthas not increased in the last 30 minutes
If you get alerted, always check the logs for what the problem could be.